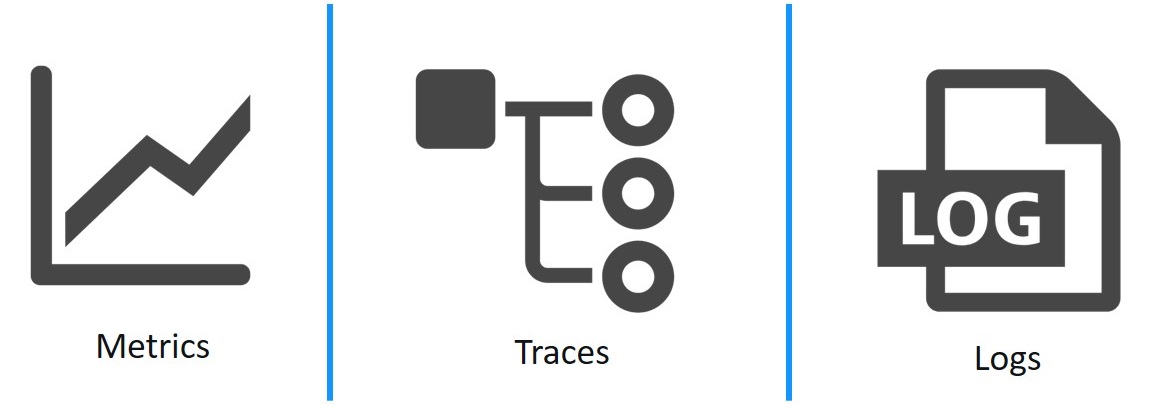
12 minutes
Observability with OpenTelemetry: Traces, Metrics and Logs

1. Introduction
Observability is the foundation for understanding, debugging, and optimizing modern distributed systems. In cloud-native environments, where applications are composed of microservices running across dynamic infrastructure, traditional monitoring falls short. Observability goes beyond metrics and logs, it enables you to answer not just “what” happened, but “why” it happened.
OpenTelemetry (OTel) has emerged as the industry standard for collecting traces, metrics, and logs in a unified, vendor-neutral way. Unlike legacy instrumentation, which often required proprietary agents and fragmented APIs, OTel provides a consistent, open-source approach that works across languages, platforms, and backends. This means you can instrument your code once and export telemetry data to any supported tool, from Jaeger to Prometheus to Datadog.
In this article, we’ll revisit the core concepts of observability, highlight the advantages of OpenTelemetry, and provide practical guidance for integrating OTel into your cloud-native workflows.
2. What is OpenTelemetry?
OpenTelemetry (OTel) is a Cloud Native Computing Foundation (CNCF) project that has quickly become the standard for observability data collection. As an open-source, vendor-neutral framework, OTel unifies the instrumentation of traces, metrics, and logs across languages and platforms. It solves the fragmentation and lock-in of legacy monitoring by providing a consistent API and data model, making it easy to switch or combine backends as your needs evolve. The project’s rapid growth and strong community support have led to a mature ecosystem, with integrations for most major observability tools and cloud providers.
3. How OpenTelemetry Works
OpenTelemetry is designed to make the collection and export of observability data simple, flexible, and consistent across languages and platforms. Its architecture is modular, allowing you to instrument applications, process telemetry, and export data to your preferred backend with minimal friction.
SDKs and APIs: OTel provides language-specific SDKs and APIs for instrumenting your applications. You can choose manual instrumentation for fine-grained control, or leverage automatic instrumentation to capture common signals with minimal code changes. Supported languages include Java, Python, Go, Node.js, .NET, and more.
Instrumentation: Manual vs Automatic: Manual instrumentation lets you define exactly what gets traced or measured, ideal for custom business logic. Automatic instrumentation uses libraries or agents to hook into frameworks and runtime events, quickly enabling traces and metrics for HTTP requests, database calls, and more.
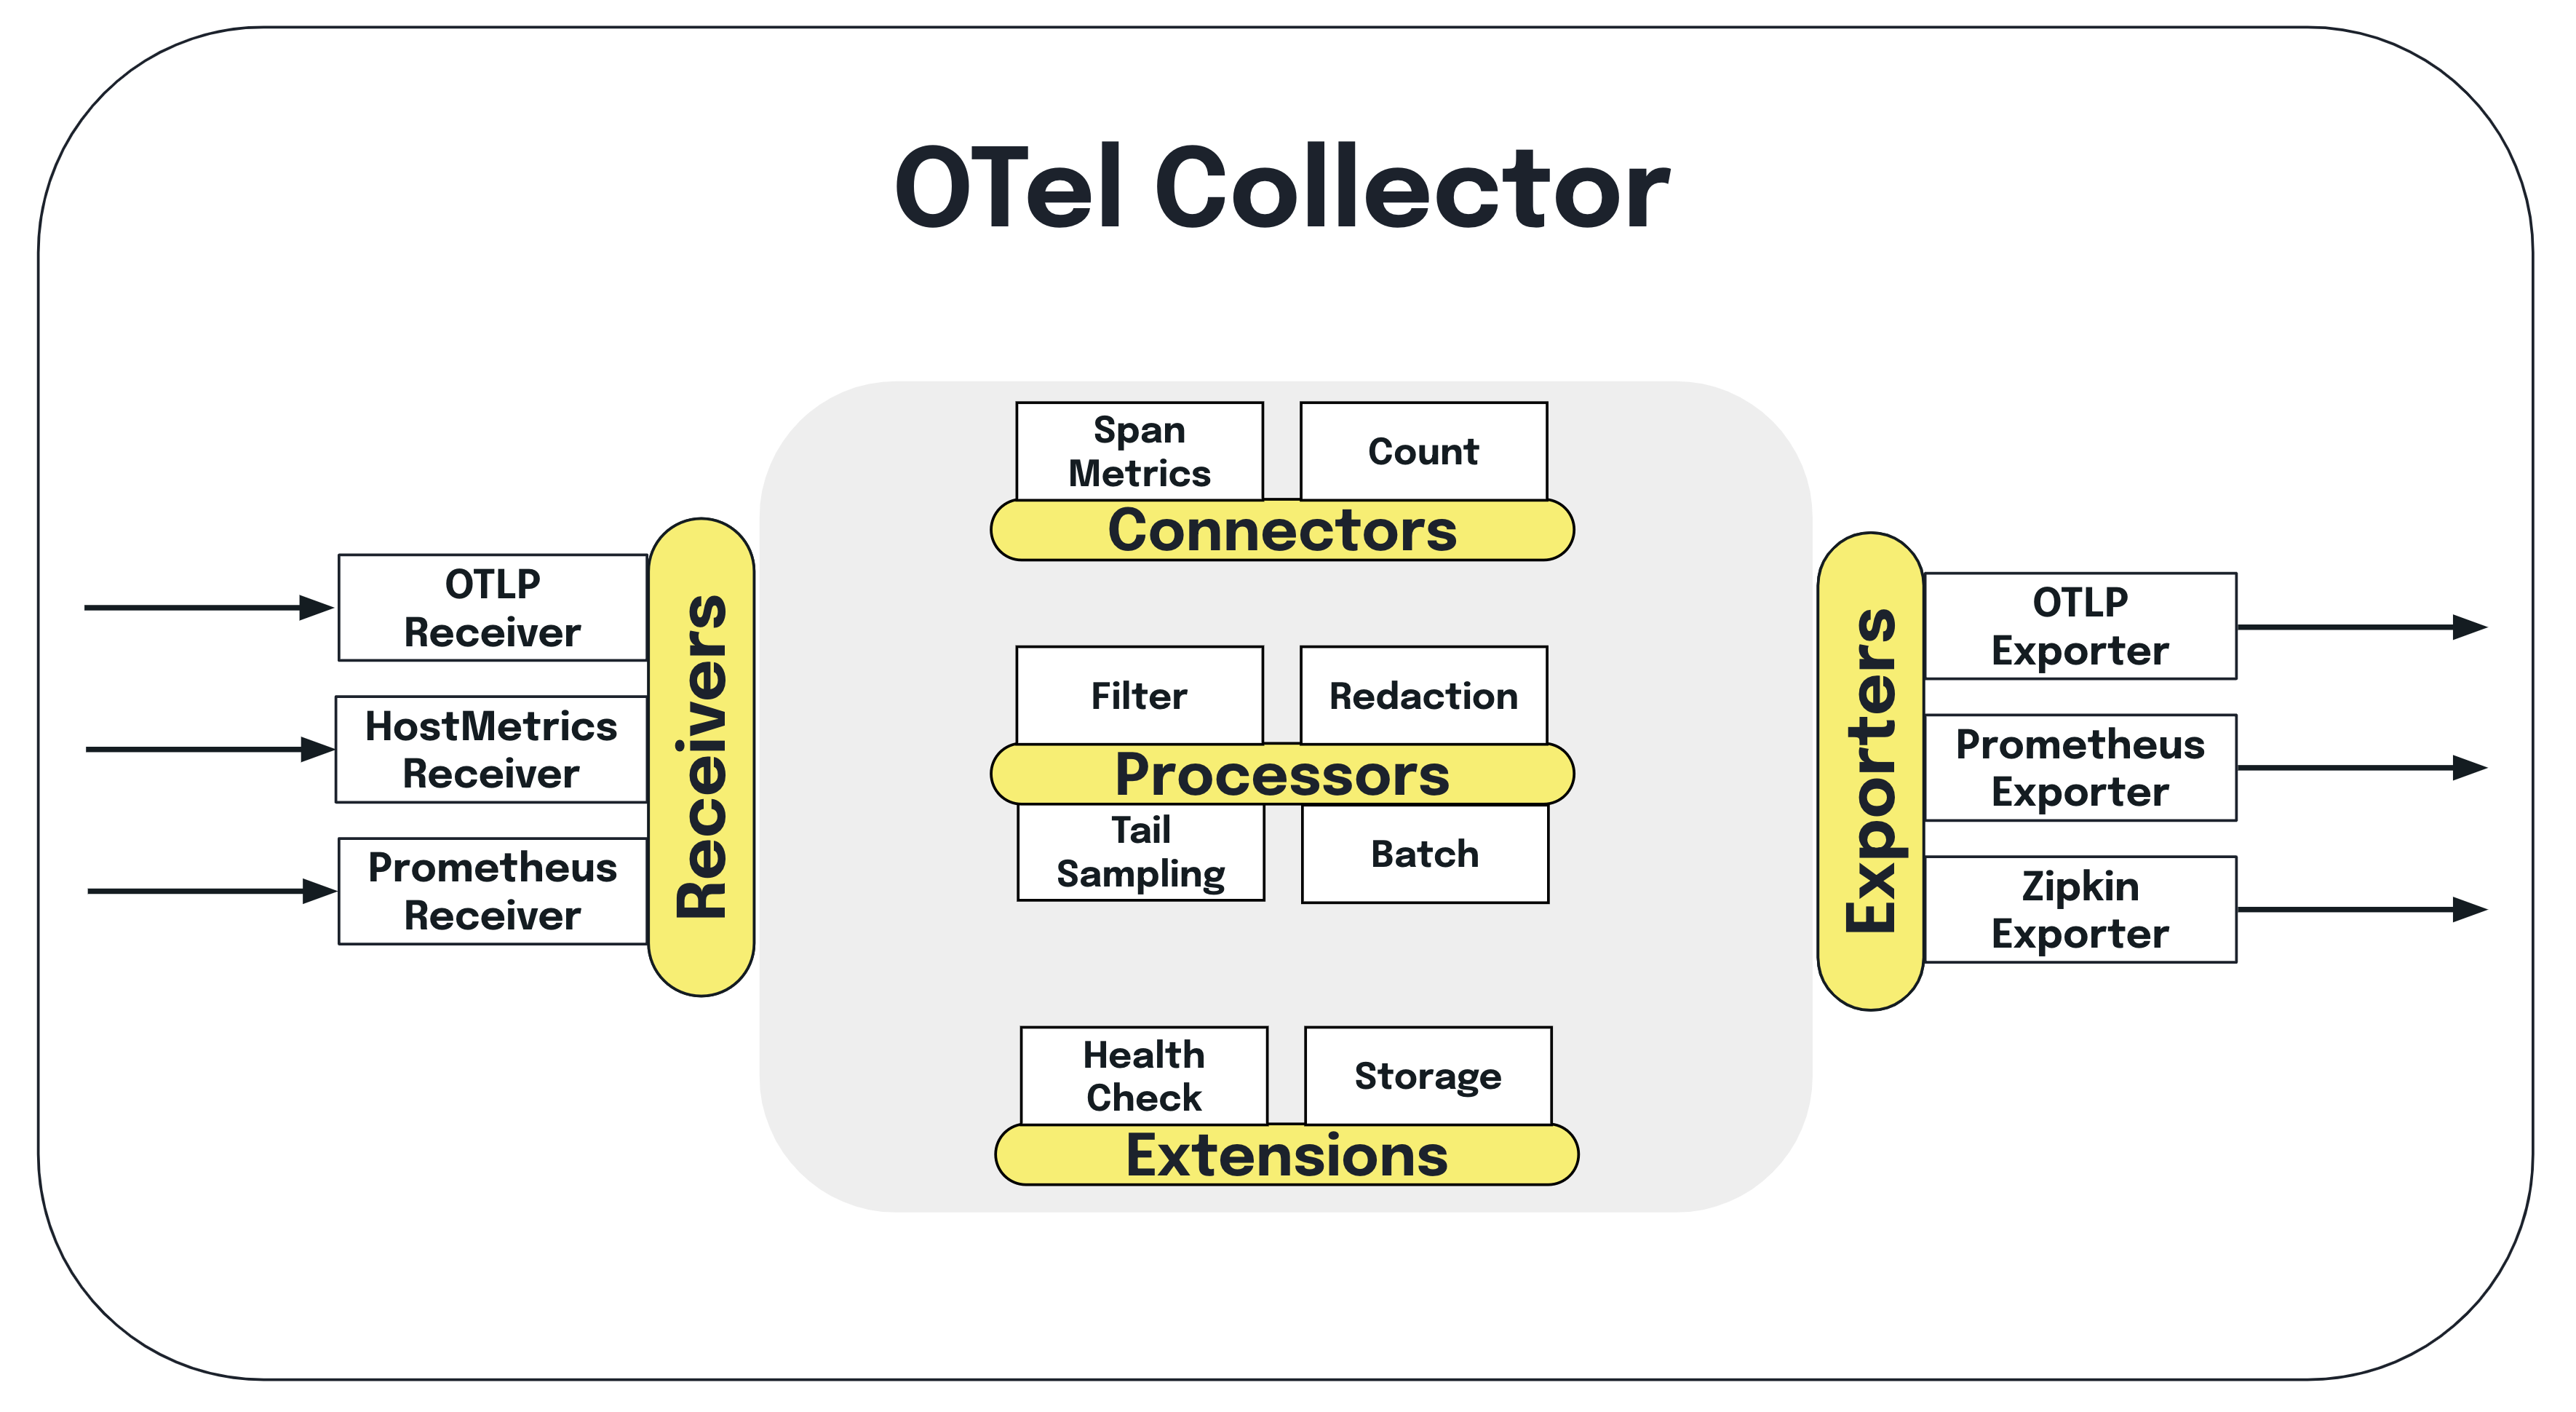
The OTel Collector: The Collector is a standalone service that receives, processes, and exports telemetry data. It decouples instrumentation from backend configuration, so you can change destinations or add processing steps without redeploying your apps. The Collector supports a wide range of receivers (for ingesting data), processors (for filtering, batching, or transforming), and exporters (for sending data to backends like Jaeger, Prometheus, or Datadog).
Data Pipeline: The typical flow is: Application → OTel SDK → Collector → Backend. Apps emit traces, metrics, and logs via the SDK; the Collector ingests and processes these signals, then exports them to your chosen observability platform. This pipeline is highly configurable, supporting multi-tenant setups, custom sampling, and advanced routing.
By separating instrumentation from data processing and export, OpenTelemetry enables scalable, maintainable observability architectures that can evolve with your stack and requirements.

4. OpenTelemetry Signal Types
4.1 Traces
Distributed tracing is at the heart of understanding how requests flow through microservices and cloud-native systems. In OpenTelemetry, a trace represents the journey of a single request as it traverses multiple services and components. Each operation within a trace is captured as a span, which records timing, metadata, and relationships to other spans.
Spans are linked by Trace IDs and Parent/Child relationships, allowing you to reconstruct the full path of a request, even as it crosses network boundaries. Context propagation, using mechanisms like Baggage and Correlation IDs, ensures that trace context is carried across service calls, so you can correlate events and diagnose bottlenecks or failures end-to-end.
OpenTelemetry integrates with popular tracing backends such as Jaeger, Tempo, and Zipkin, making it easy to visualize traces, analyze performance, and pinpoint issues in distributed systems. Use tracing to optimize latency, debug complex flows, and improve reliability across your stack.
4.2 Metrics
Metrics provide quantitative insight into the health and performance of your systems. In OpenTelemetry, metrics are emitted as time-series data and can be used to track everything from request rates to resource usage and error counts.
OTel supports several metric types:
- Counter: Monotonically increasing value, ideal for counting requests or errors.
- Gauge: Represents a value that can go up or down, such as memory usage or active connections.
- Histogram: Captures the distribution of values, useful for latency or request size analysis.
Metrics are aggregated and scraped at regular intervals, enabling real-time monitoring and alerting. Common use cases include tracking service-level objectives (SLOs), monitoring resource consumption, and identifying performance bottlenecks.
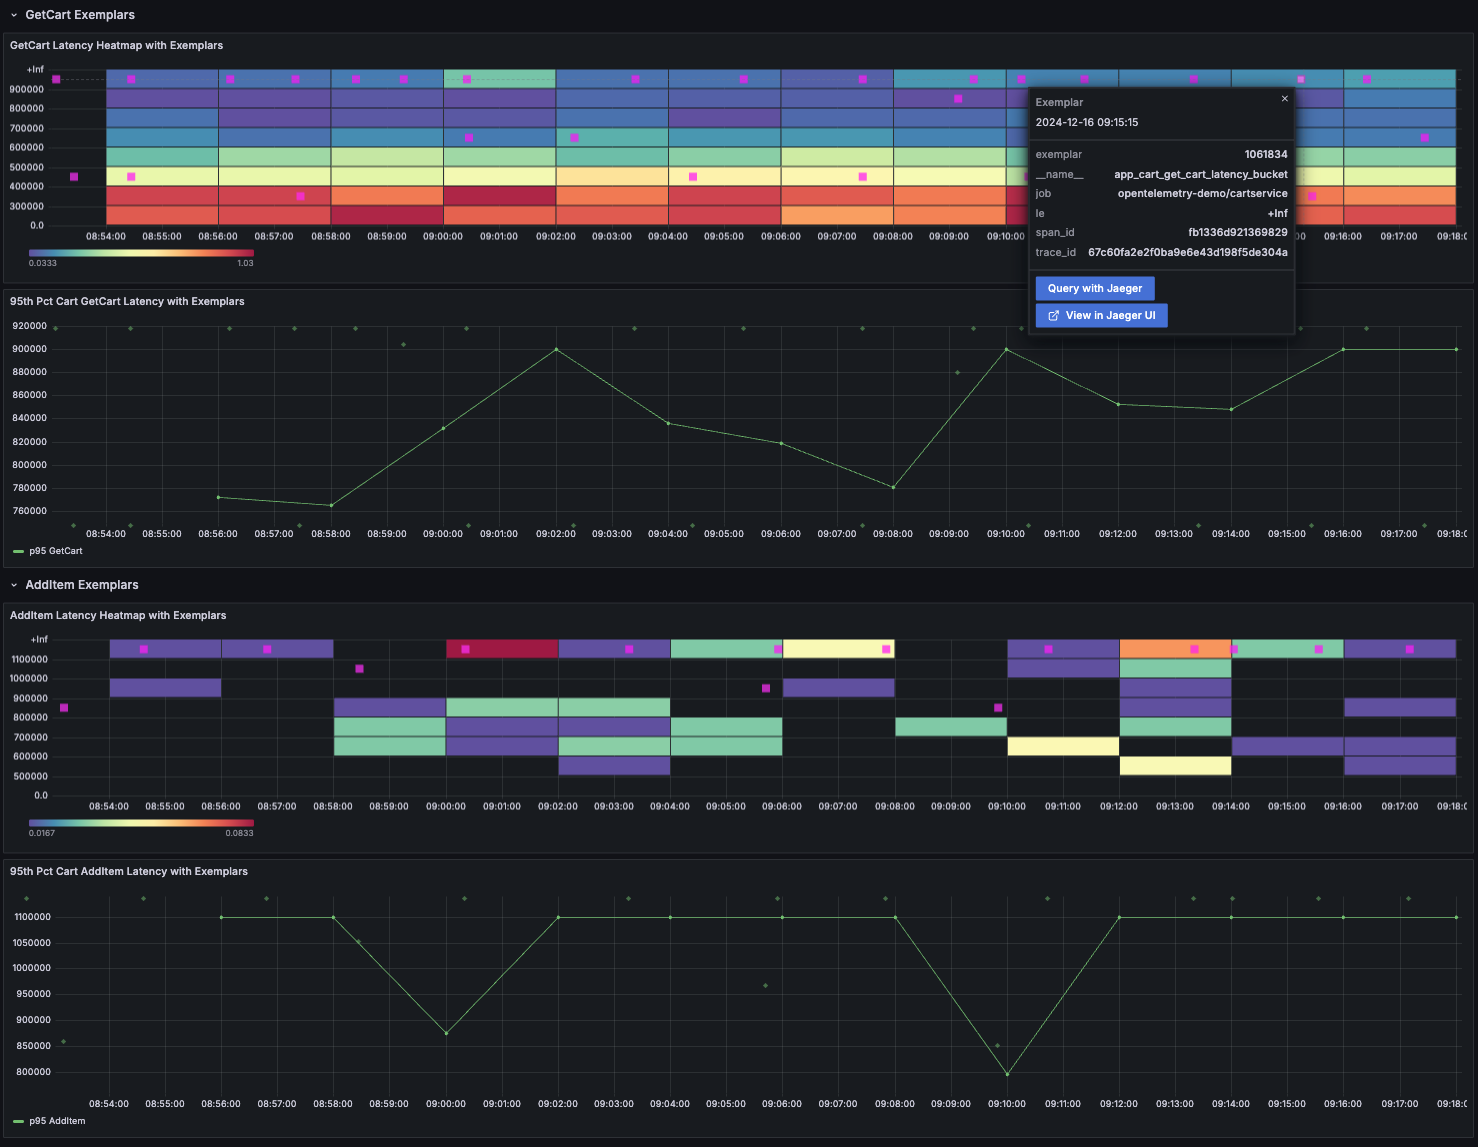
OpenTelemetry integrates seamlessly with Prometheus, the de facto standard for metrics in cloud-native environments. You can export OTel metrics to Prometheus and visualize them in Grafana, enabling powerful dashboards and alerting workflows.
4.3 Logs
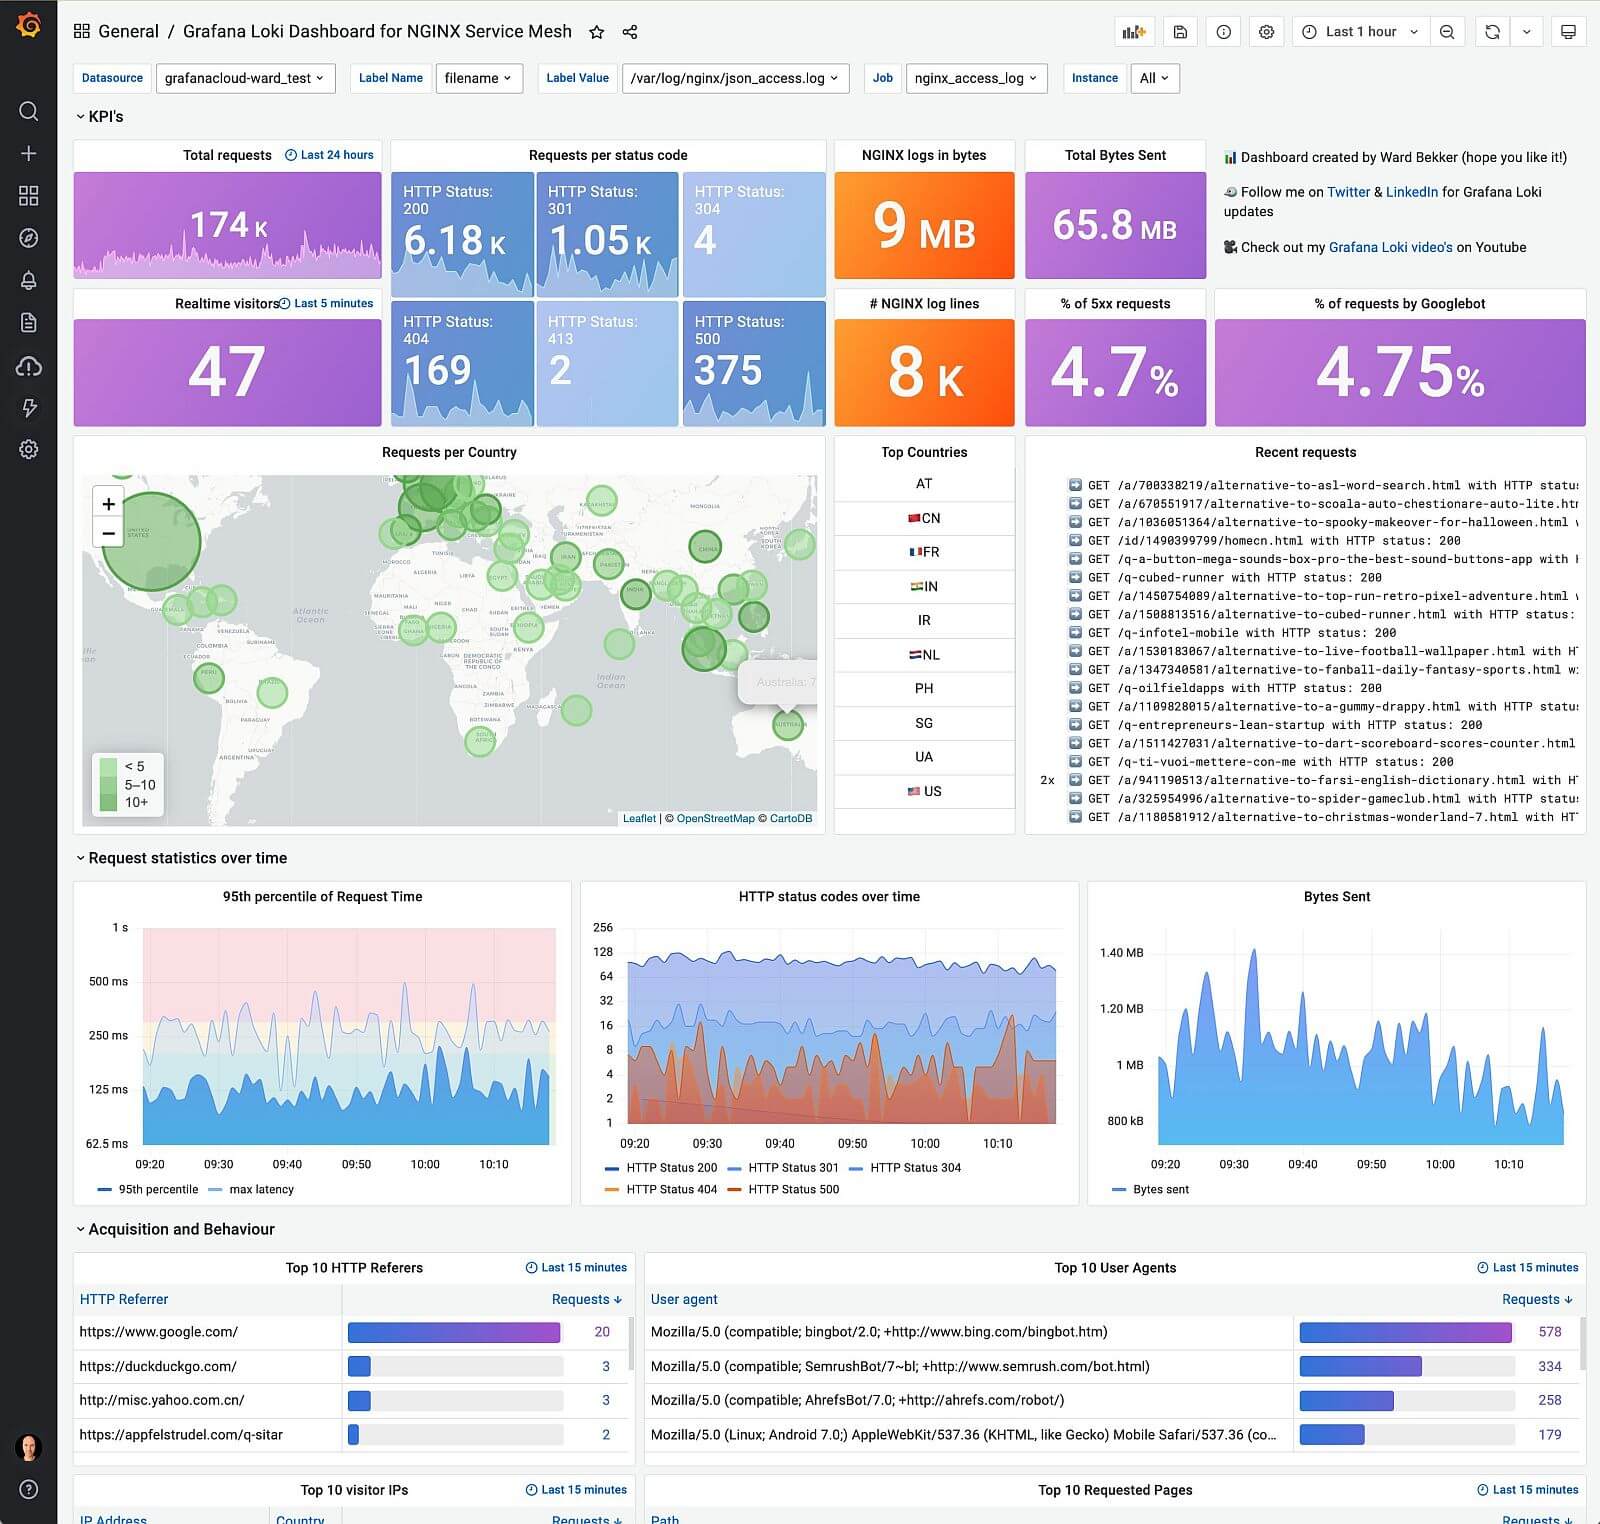
Logs capture detailed events and errors that occur within your applications, providing essential context for debugging and root cause analysis. OpenTelemetry supports both structured logs (key-value pairs, JSON) and unstructured logs (plain text), with a growing emphasis on structured formats for better search and correlation.
One of OTel’s strengths is the ability to correlate logs with traces, so you can see log entries in the context of a distributed request. This makes it easier to diagnose issues that span multiple services or components.
Currently, log support in OpenTelemetry is evolving. While tracing and metrics are mature, logging APIs and collector integrations are still being standardized. Some limitations remain, such as inconsistent log formats and incomplete support across languages, but the roadmap includes unified log pipelines and improved correlation features.
For now, use OTel to enrich logs with trace context and export them to backends like Elasticsearch, Splunk, or cloud-native log solutions. Stay tuned as the ecosystem matures and unified observability pipelines become the norm.

5. Integrating OpenTelemetry with Popular Tools
5.1 Prometheus + Grafana
OpenTelemetry makes it straightforward to collect application metrics and export them to Prometheus, the standard metrics backend for cloud-native environments. By instrumenting your code with OTel, you can expose metrics endpoints that Prometheus scrapes at regular intervals.
Once metrics are in Prometheus, Grafana can be used to build dashboards and set up alerts, providing real-time visibility into application performance, resource usage, and SLOs. This integration enables teams to monitor latency, error rates, and throughput with minimal setup.
Use Case: App performance monitoring, track request rates, latency, and error counts for your services, visualize trends in Grafana, and set up alerts to proactively address issues before they impact users.
5.2 EKS Stack (AWS)
OpenTelemetry is well-supported in Amazon EKS (Elastic Kubernetes Service), making it easy to collect traces, metrics, and logs from your Kubernetes workloads. You can deploy the OTel Collector as a sidecar (per Pod) for fine-grained control, or as a DaemonSet for cluster-wide collection.
AWS Distro for OpenTelemetry (ADOT) provides pre-built collectors and integrations, streamlining setup and management. With ADOT, you can export telemetry data directly to AWS services like CloudWatch (metrics/logs) and X-Ray (traces), enabling unified monitoring and troubleshooting across your cloud-native stack.
This integration allows you to correlate infrastructure and application signals, monitor service health, and quickly diagnose issues in production Kubernetes environments.
5.3 New Relic
New Relic offers full compatibility with OpenTelemetry, allowing you to send traces, metrics, and logs directly from OTel-instrumented applications. The New Relic OTel exporters make it easy to route telemetry data to the New Relic backend, where you can leverage advanced analytics and visualization features.
Auto-instrumentation is supported for many languages, enabling distributed tracing and performance monitoring with minimal code changes. This integration provides deep visibility into end-to-end transactions, helping you monitor latency, errors, and dependencies across your entire stack.
Use Case: End-to-end transaction monitoring, trace requests as they flow through multiple services, identify bottlenecks, and correlate errors for rapid troubleshooting in complex environments.
5.4 Datadog
Datadog supports ingesting telemetry data from OpenTelemetry, making it easy to unify observability signals across your stack. You can choose to use native Datadog SDKs for advanced features, or standardize on OTel for portability and vendor neutrality.
Datadog correlates logs, traces, and metrics, providing full-stack visibility and powerful analytics for SaaS and cloud-native applications. This integration enables you to monitor service health, track dependencies, and troubleshoot issues with rich context.
Use Case: Full-stack visibility for SaaS, aggregate signals from multiple services, correlate user actions with backend events, and leverage Datadog’s dashboards and alerting to maintain reliability and performance.
5.5 Other Notable Tools and Stacks
OpenTelemetry’s vendor-neutral approach means you can integrate with a wide range of observability backends, each with unique strengths:
- Jaeger: Open-source tracing backend, ideal for visualizing distributed traces and diagnosing latency issues.
- Tempo: Grafana Labs’ scalable tracing backend, designed for high-volume, cost-effective trace storage and integration with Grafana dashboards.
- Splunk Observability: Enterprise-grade platform for unified metrics, traces, and logs, with advanced analytics and alerting.
- Honeycomb: Event-based observability, excels at high-cardinality analysis and debugging complex systems.
- Elastic Stack: Powerful for log and metrics aggregation, search, and visualization; integrates well with OTel for unified pipelines.
- Lightstep: Focuses on distributed tracing and root cause analysis, with strong support for large-scale, multi-service environments.
Choose the backend that best fits your scale, analysis needs, and existing stack, OpenTelemetry makes it easy to switch or combine tools as requirements evolve.

6. Language-Specific Instrumentation
OpenTelemetry provides robust instrumentation libraries for all major languages, making it easy to capture traces, metrics, and logs from your applications:
- Java: Extensive support for frameworks like Spring Boot, with both manual and auto-instrumentation options.
- Python: Integrates with Flask, Django, and other popular frameworks; auto-instrumentation available via OTel agents.
- Go: Supports net/http, gRPC, and custom middleware; manual instrumentation is common, but auto-instrumentation is evolving.
- Node.js: Works with Express, Fastify, and other frameworks; auto-instrumentation covers HTTP, database, and more.
- .NET: ASP.NET Core and other .NET apps can be instrumented with OTel SDKs and agents.
Auto-instrumentation is recommended for rapid adoption and coverage of common libraries, while manual instrumentation allows for deeper customization and business logic tracing. Check the official OTel docs for the latest language support and best practices.
7. Deployment Patterns and Best Practices
-
Sidecar, Agent, DaemonSet:
- Sidecar: Attach OTel Collector as a sidecar to each Pod for granular telemetry and isolation; ideal for multi-tenant or per-service customization.
- Agent: Run OTel Collector as a node-level agent for centralized collection; reduces resource overhead but may limit per-service config.
- DaemonSet: Deploy Collector as a DaemonSet for cluster-wide coverage; best for infrastructure signals and uniform config.
-
Exporters vs Native Backends:
- Use OTel exporters to route data to multiple backends (Prometheus, Jaeger, Datadog, etc.) for flexibility and migration.
- Prefer native backend integrations for performance and advanced features, but keep exporter config modular for future changes.
-
Sampling Strategies:
- Apply head-based or tail-based sampling to control trace volume and cost; use dynamic sampling for high-cardinality workloads.
- Always sample at the edge (ingress) to avoid missing critical traces; propagate sampling decisions downstream.
-
Securing Telemetry Data:
- Encrypt telemetry in transit (TLS) and at rest; restrict Collector endpoints to trusted sources.
- Scrub sensitive data before export; use attribute filters and processors to enforce compliance (GDPR, PCI, etc.).
-
Multi-Tenant Considerations:
- Isolate telemetry pipelines per tenant using namespaces, labels, or separate Collectors.
- Enforce resource quotas and rate limits to prevent noisy neighbor issues.
- Use multi-tenant backends or partitioned storage for scalable, secure observability.

8. Challenges and Pitfalls
-
Performance Overhead:
- Instrumentation can introduce latency and resource consumption; benchmark and tune Collector and SDK settings for production workloads.
- Use sampling, batching, and filtering to minimize impact on critical paths.
-
Over-Instrumentation:
- Excessive spans, metrics, or logs can overwhelm backends and obscure signal quality; focus on key transactions and error paths.
- Regularly audit instrumentation coverage and prune unnecessary signals.
-
Correlating Signals (Trace/Metric/Log Sync):
- Ensure consistent context propagation (Trace IDs, Baggage) across all signals for effective correlation and troubleshooting.
- Use unified pipelines and backends that support cross-signal linking; avoid fragmentation between tools.
-
Choosing the Right Backend:
- Evaluate scalability, retention, and analytics features before committing; consider migration paths and vendor lock-in risks.
- Test integrations in staging to validate compatibility and performance before full rollout.
9. Future of OpenTelemetry
-
Logs Standardization:
- Expect unified logging APIs and formats across languages, enabling seamless correlation with traces and metrics.
- OTel log pipeline maturity will drive adoption of structured, context-rich logs for cloud-native debugging.
-
Expanding Exporters and Receivers:
- Rapid growth in supported backends and integrations; new exporters and receivers for emerging platforms and cloud services.
- Community-driven enhancements will improve compatibility and reduce vendor lock-in.
-
Unified Observability Pipelines:
- Convergence of traces, metrics, and logs into a single pipeline for simplified management and analysis.
- End-to-end context propagation and cross-signal analytics will become standard, enabling deeper insights and faster troubleshooting.
-
Ecosystem Growth:
- More SDKs, agents, and processors for niche languages and frameworks.
- Increased adoption in serverless, edge, and IoT environments.
- Enhanced support for data privacy, security, and compliance requirements.
Stay informed and engaged with the OpenTelemetry community to leverage the latest advancements and contribute to the evolution of observability.

10. Final Thoughts and Recommendations
-
When to Start Using OpenTelemetry:
- Adopt OTel early in cloud-native projects to avoid costly retrofitting and maximize observability from day one.
- Migrate incrementally, start with traces, then add metrics and logs as your needs mature.
-
Tooling Choices: Single Vendor vs Composable Stack:
- Single-vendor solutions offer simplicity and deep integration, but may limit flexibility and increase lock-in risk.
- Composable stacks (mixing OTel with multiple backends) provide portability, customization, and future-proofing; require more operational overhead.
- Evaluate your team’s expertise, scale, and compliance needs before choosing a strategy.
-
Recommended Learning Path and Resources:
- Start with the official OpenTelemetry docs and CNCF webinars for fundamentals.
- Explore sample apps and reference architectures on GitHub to see real-world implementations.
- Join the OTel community (Slack, GitHub, mailing lists) for support, updates, and best practices.
- Stay current with ecosystem changes, new SDKs, exporters, and integrations are released frequently.
-
Final Advice:
- Treat observability as a first-class concern, embed it in your development, deployment, and incident response workflows.
- Regularly review and refine your instrumentation and pipelines to keep pace with evolving requirements and technologies.
Appendix
-
Glossary of Key Terms:
- Span: The fundamental unit of a trace, representing a single operation or request.
- Trace: A collection of spans that together describe the end-to-end journey of a request.
- Collector: The OpenTelemetry service that receives, processes, and exports telemetry data.
- Exporter: Component that sends telemetry data from the Collector or SDK to a backend (e.g., Jaeger, Prometheus).
- Receiver: Collector module that ingests telemetry data from various sources.
- Processor: Collector module that transforms, filters, or batches telemetry data before export.
- Sampler: Determines which traces are collected and exported, controlling data volume and cost.
-
Links to Official Docs and SDKs:
-
Sample Applications and GitHub Repos: